Context for everything else you track
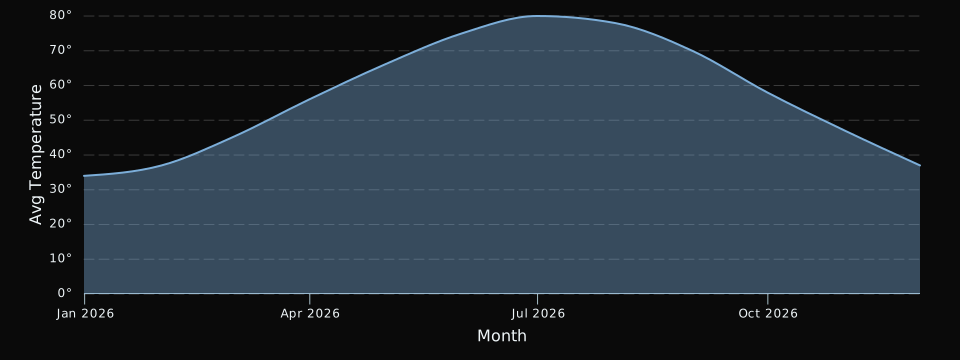
Weather is the variable that sits quietly behind a lot of other data. Activity, time spent outdoors and daylight hours all move with the seasons, and if you’re looking at a metric without knowing what the weather was doing, you’re missing context that’s freely available.
DayDash pulls hourly local weather — history and forecast — so it lands on the same timeline as everything else you track.
Questions people explore with this
- How does my activity level move with temperature across a year?
- What did daylight hours look like during a stretch I want to understand?
- How much do I train in different conditions?
- What’s the relationship between the seasons and the rest of my data?
Historical archive plus forecast
The connector runs in two modes. Archive mode backfills real observed history for your location, so your charts have depth from day one. Forecast mode keeps the coming days populated, which makes weather useful for planning rather than only for looking back.