Your team’s issue history, as data
Linear keeps a precise record of how work moves: when an issue was created, when someone started it, when it closed, and every status it passed through on the way. Over a few months that becomes a detailed history of how your team actually works.
DayDash brings that history across as time-series data and puts it on the same timeline as everything else you track, so you can build the dashboards you want around it.
What comes across
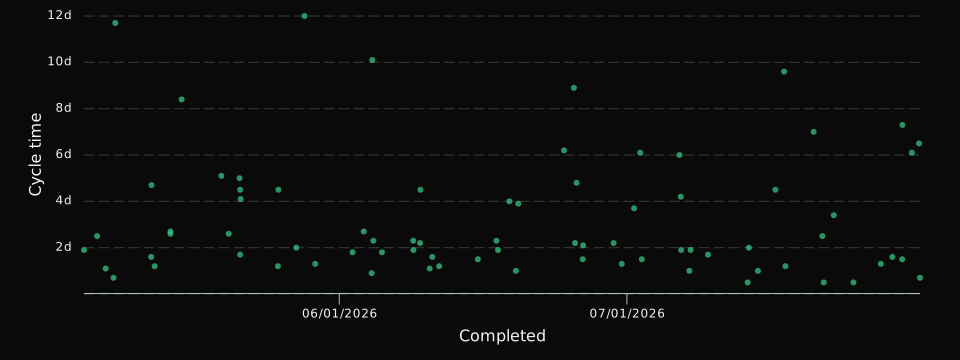
Issues is one row per issue in the teams you pick, archived issues included. Each row carries the issue’s current status, assignee, priority, estimate, labels and project, its parent issue, and when it was created, started, completed or canceled. DayDash also works out each issue’s cycle time (started to completed) and lead time (created to completed), so both are ready to chart as they are.
Status History is optional. It’s one row per stretch of time an issue spent in a status: when it entered, when it left and how long it stayed. That’s the section for questions about where work waits.
Questions people explore with this
- How long does an issue usually take from started to done, and how wide is the spread?
- Which statuses do issues spend the most time sitting in?
- How many issues does each project close in a month?
- What share of the issues we create end up canceled rather than completed?
- How does the number of issues I finish in a week move alongside my focused hours?
Tips for good charts
Status names belong to each team, so the same step can be called something different in two teams. Every status also has a Linear status type, such as backlog, started or completed, and the types are shared across teams. Chart the status type when you’re comparing teams.
Estimates use each team’s own scale, so they’re best charted per team rather than summed across teams.
Read-only
DayDash reads your issues and their status history. It does not create, edit, assign, comment on or close issues — nothing in DayDash writes back to Linear.