A reading habit you can actually look at
Reader collects the things you meant to read — articles, newsletters, PDFs, threads, videos — and keeps track of how far you got into each one and what you highlighted along the way. Over a year that becomes a detailed record of your attention.
DayDash brings that record across as data you can chart, and puts it beside the rest of what you track.
What comes across
Documents is one row per thing you saved, with its category, where it sits in your pipeline, how much of it you’ve read, the word count, the source, and how much time you spent reading or listening. Highlights is one row per highlight, with its note and a reference back to the document it came from.
Together they cover both halves of the habit: what you take in, and what you thought was worth keeping.
Questions people explore with this
- How much do I save in a week, and how much of it do I finish?
- Which sources do most of my saved reading come from?
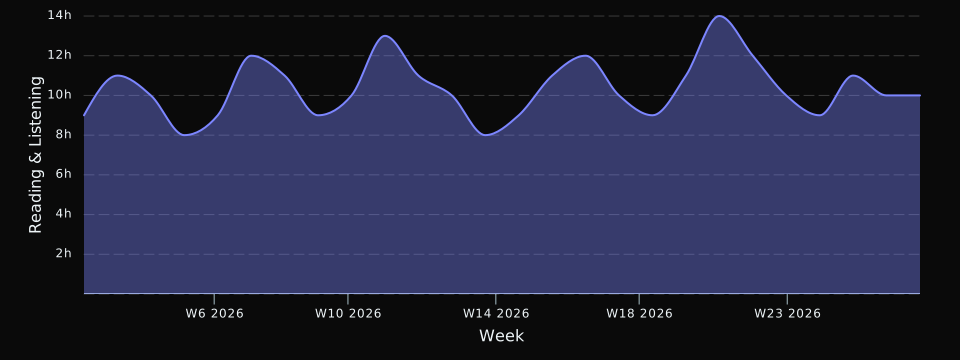
- Does my reading time hold steady across a year, or move in seasons?
- How many highlights do I keep per hundred articles — and has that changed?
Saved and read are different numbers
The interesting thing about this dataset is usually the gap between the two. Reader tracks saves and reading progress separately, so you can chart what arrives against what you actually get through, rather than assuming they match. Most people find they don’t, and the shape of that gap over a year is more informative than either number alone.
Read-only
DayDash reads your document list and your highlights. It does not save documents, edit highlights, archive anything, or change your pipeline — nothing in DayDash writes back to Reader.